Segments
Analyse a subset of your beneficiaries
Introducing tags
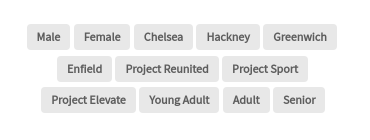
Understand your impact for a specific location, project or demographic using tags. Tags are free text labels which can be used to segment your data.
Tag your data
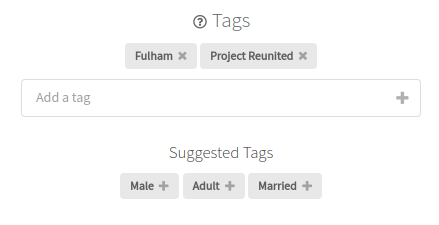
Tags can be assigned to beneficiaries or individual questionnaire responses.
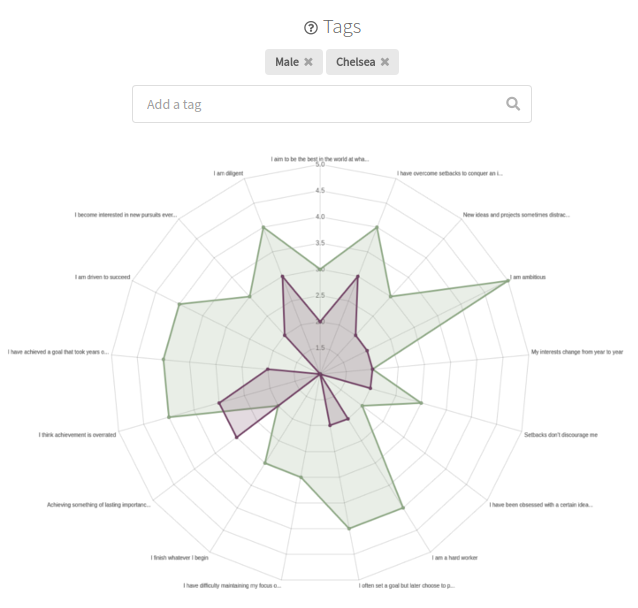
Report on a subset of beneficiaries
Generate reports for a given set of tags. Only questionnaire responses with matching tags will be included in the report.
Interested in knowing the impact of a particular project? Generate a report for that project's tag.