Reporting
Produce visualisations to demonstrate your impact
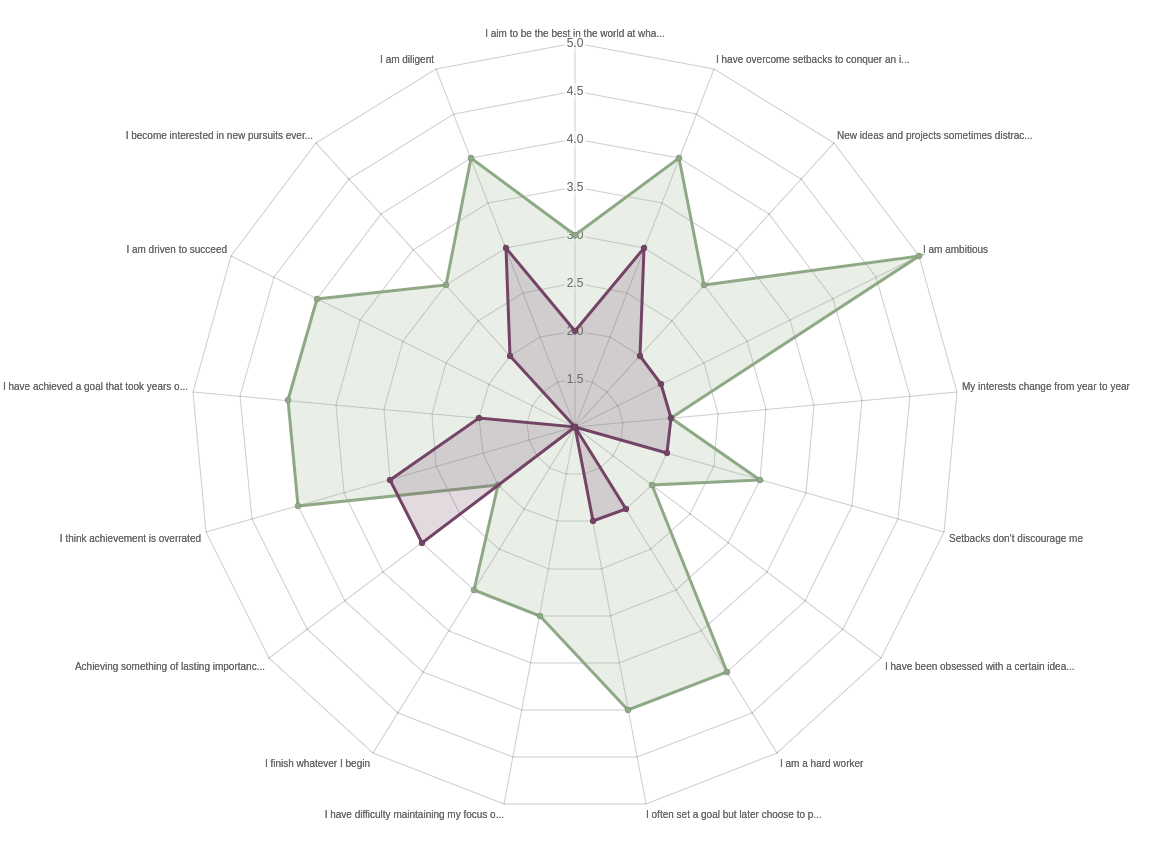
Visualise your impact
View the average distance travelled by your beneficiaries, as a result of your intervention. Download visualisations to include in your impact reports.
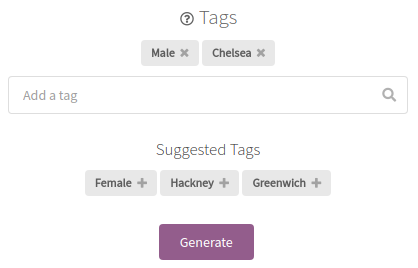
Report on a subset of beneficiaries
Generate reports for a particular project, location or demographic using tags. See the segments feature page for more information.
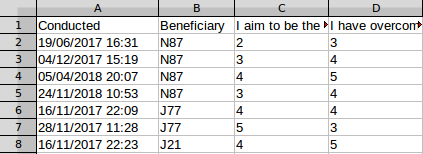
Export the report's data
The data used to produce the report can be exported to Excel for backup, verification or custom analysis.